Saturday 26 September 2015

Cadence Analysis Using Fitbit API Per Minute Data

Arghhh - the curse of my injured calf muscles has struck again :-(.  Avid Geek Dad blog readers will remember how back in 2013 I used a Raspberry Pi camera to video myself and spot calf injury causing strength in-balances between my left and right sides.

Well the injury is back and a visit to a specialist gave me two tips as to what to do to resolve the problem:

  1. Strengthen my calf muscles.  Depressingly as a gentlemen such as myself enters middle age he will generally lose 10% of muscle strength per year.  Hence I need to work ever harder to keep my muscles strong and injury free.
  2. Shorten my running stride.  Video analysis showed I was over-striding; my front foot was landing in front of my hip putting extra strain on my calf muscles for every stride.  

When it comes to strengthening, that's fine.  I just need to do more heel raises etc.

It's shortening my running stride that has the best geek potential.  Optimally my foot should land under my hip and apparently the best way to do this is to increase my running cadence, i.e. take shorter steps but do more of them.

So the challenge is to increase my cadence but what's the baseline here?  What do I do naturally and by how many should I increase this?  Sounds like I need some data...

As described in previous posts, I've got a Fitbit Charge HR and can use the Fitbit API to access my data.  The plan was to use Fitbit activity data (specifically steps data) to see how many steps I'm taking during specific runs.  Initially this looked to be a non-starter as:

  1. The API by default only gives you daily data.
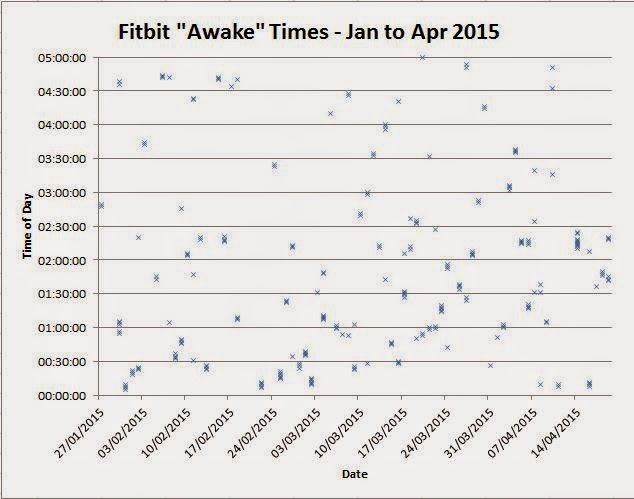
  2. The only data analysis tool provided by Fitbit only provides data for 15 minute intervals (see below).

...however I needed per minute data (as cadence = steps per minute).


The answer came from the Fitbit API online documentation set.  Specifically that if you request it, Fitbit will allow people to "intraday" data via the API.  Apparently they look particularly favourably on people looking to use data for personal projects.  A quick email interchange later with the awesome people from Fitbit and I had access to delicious per minute data.

So an example URL to access the one minute step data resource is:
https://api.fitbit.com/1/user/-/activities/steps/date/2015-07-11/1d/1min/time/09:00/09:30.json

What I did find is that the Python Fitbit API wrapper that I'd previously used didn't work when trying to access this resource; the Python script threw an error every time.  Hence I had to work out how to directly access the API.

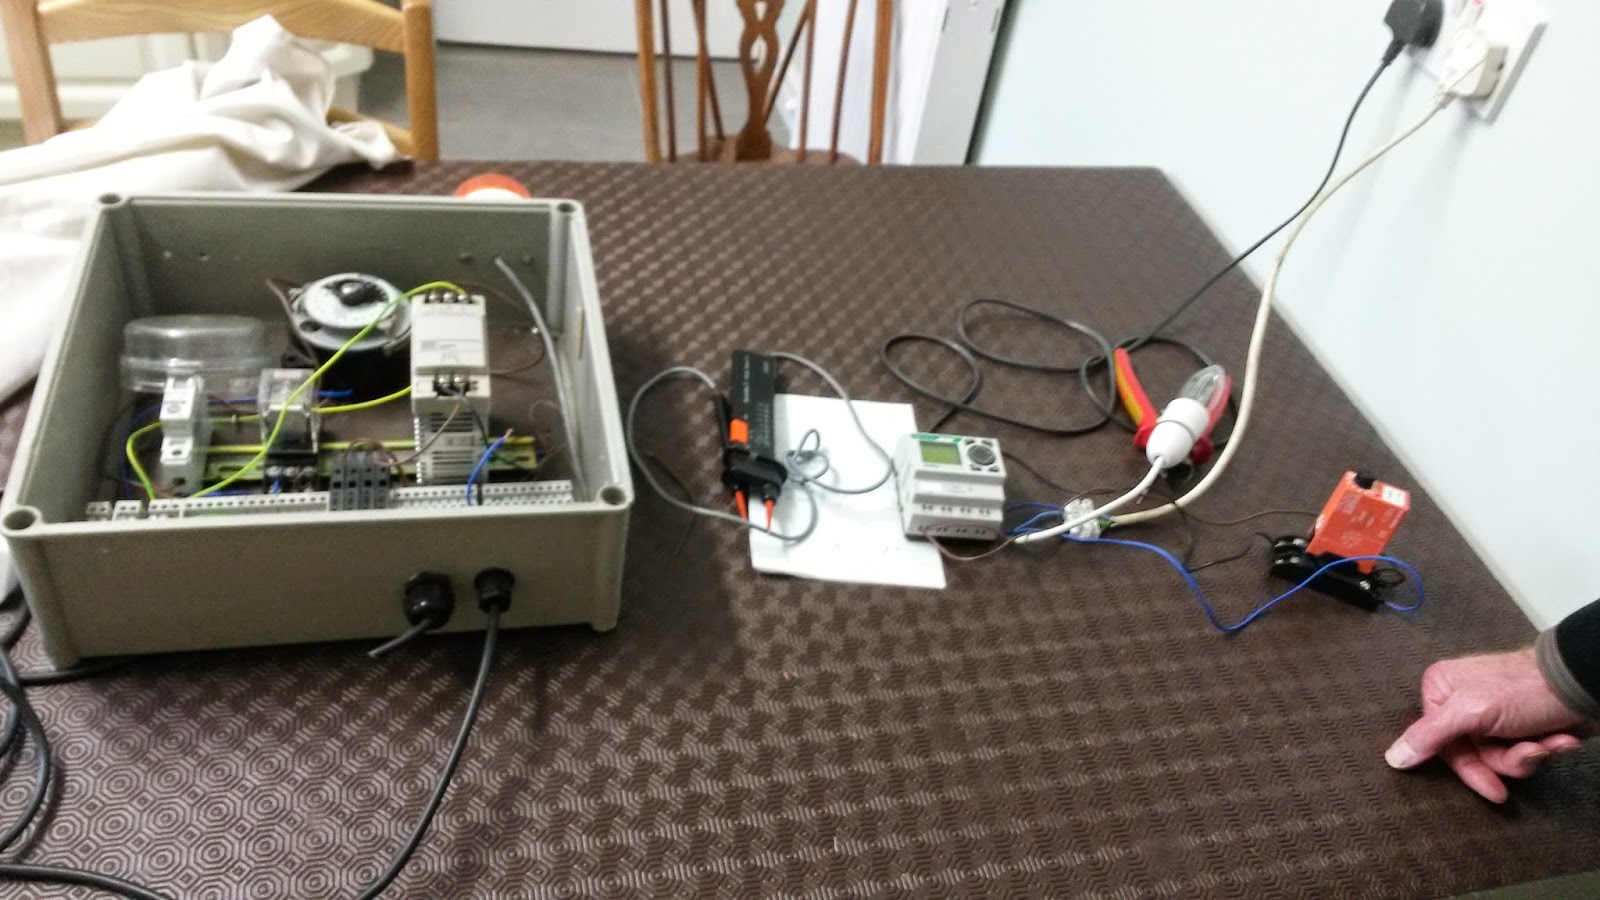
This tool provided by Fitbit provides a step by step guide to accessing the Fitbit API via OAUTH 1.0.  The final step allows you to formulate the API call to be made and even specifies the cURL command to use (which I executed with my Raspberry Pi).  Typical API output is:

{"activities-steps":[{"dateTime":"2015-09-26","value":"4761"}],"activities-steps-intraday":{"dataset":[{"time":"09:00:00","value":108},{"time":"09:01:00","value":169},{"time":"09:02:00","value":154},{"time":"09:03:00","value":56},{"time":"09:04:00","value":10},{"time":"09:05:00","value":43},{"time":"09:06:00","value":158},{"time":"09:07:00","value":173},{"time":"09:08:00","value":173},{"time":"09:09:00","value":175},{"time":"09:10:00","value":175},{"time":"09:11:00","value":174},{"time":"09:12:00","value":173},{"time":"09:13:00","value":171},{"time":"09:14:00","value":174},{"time":"09:15:00","value":175},{"time":"09:16:00","value":171},{"time":"09:17:00","value":174},{"time":"09:18:00","value":172},{"time":"09:19:00","value":174},{"time":"09:20:00","value":171},{"time":"09:21:00","value":171},{"time":"09:22:00","value":171},{"time":"09:23:00","value":172},{"time":"09:24:00","value":173},{"time":"09:25:00","value":174},{"time":"09:26:00","value":170},{"time":"09:27:00","value":173},{"time":"09:28:00","value":173},{"time":"09:29:00","value":154},{"time":"09:30:00","value":107}],"datasetInterval":1,"datasetType":"minute"}}

So you get a summary then one data point per minute for the time period specified.  Now in the 10 minutes I gave it I tried to work out how to programatically create the URLs to be used to pull back multiple results from the Fitbit API.  The API is non-trivial (you have to compute a HMAC of the fields you specify and add it to the URL) so, with all that sumptuous geek data waiting for me I wimped out and just used the Fitbit tool to extract all the data I needed (bad geek).  I'll crack it one day and write a blog post on it.

To the analysis!  As a creature of habit I've run the same 5K run at the same time on Saturday morning 18 times this year.  (It's Parkrun - I recommend doing it if there's one near you).  I've worn my Fitbit for nearly everyone of these so getting the API data should provide me with a reliable source of cadence information.  I simply changesdthe data criteria, fired a load of API calls using cURL and stored the results in an Excel spreadsheet.  So that this isn't a totally code free post I did write some Excel VBA to pull out the steps into individual cells so I could graph the results.  Here it is:

Option Explicit

Sub SplitAndWrite()
  Dim i As Integer
  Dim GeekString As String
  Dim MyArray() As String
  Dim WriteRow As Integer
  Dim SplitItArray() As String
    
  WriteRow = 5
  
  GeekString = ActiveSheet.Cells(1, 1).Value

  MyArray = Split(GeekString, ",")
    
  For i = 0 To UBound(MyArray)
    If InStr(MyArray(i), "value") <> 0 Then
      'This be a value entity.  Split on the colon
      SplitItArray = Split(MyArray(i), ":")
      If InStr(SplitItArray(1), "]") = 0 Then
        ActiveSheet.Cells(WriteRow, 1).Value = MyArray(i)
        ActiveSheet.Cells(WriteRow, 2).Value = Left(SplitItArray(1), Len(SplitItArray(1)) - 1)
        WriteRow = WriteRow + 1
      End If
      
    End If
  Next i

End Sub

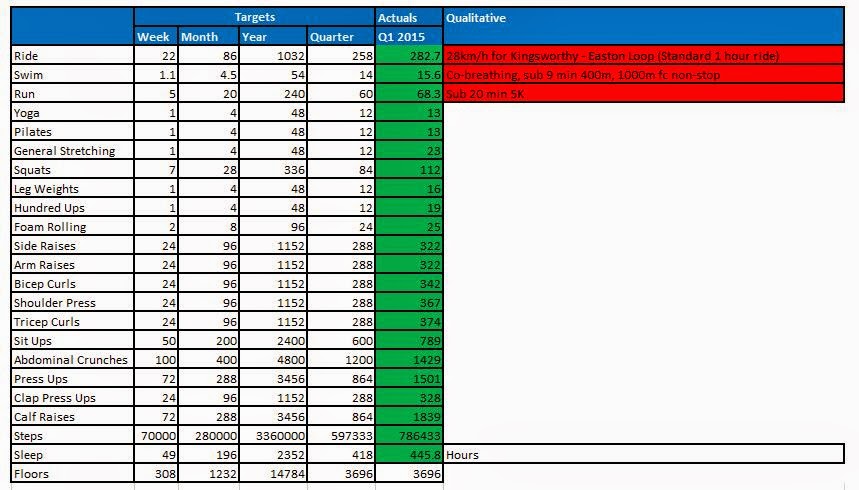
So I extracted, parsed and graphed 9 runs worth of data.  Here's the resulting graph:


Here you can see:
  • Seven runs prior to when I saw the specialist where my cadence was in the 160 to 170 range and generally diminished during the run.
  • The first run after seeing the specialist (pink series at the top) where I consciously tried to increase my cadence but didn't use anything to aid this and so saw a fast start (180 steps per min) but the usual decrease during the run.
  • The second run after seeing the specialist (green series) where I used a simple metronome app on my phone (I listened using headphones) set at 175 beats per minute.

As can be seen, using the metronome provided the best result.  It was weird listening to it going click, click, click but I soon managed to work out how to run in time with the metronome.  It also resulted inconsistent splits of ~4m50s per KM and no calf muscle pain.  Next week I'll try and increase the  metronome frequency and see what happens to the splits...

So big-up the Fitbit API and per minute data.  Fingers crossed it will really help me in my quest to cure my old man calf muscles....


Sunday 19 April 2015

Sleep Analysis Using Raspberry Pi and Fitbit API

In a previous blog post I created a sleep infographic using my Raspberry Pi to extract data from the Fitbit API.  For this I used summary data but at the time I spotted that the API response contains a value for every single minute that I spent in bed.  Full Python code for how I accessed and logged this data is contained on that previous post.

This post uses OAUTH1.0 to access the Fitbit API.  I've now "upgraded" to using OAUTH2.0.  Click here for a how-to guide.

The data in the JSON response to the Fitbit API looks like this in it's raw format:

u'minuteData': [{u'value': u'2', u'dateTime': u'22:14:30'}, {u'value': u'1', u'dateTime': u'22:15:30'}, {u'value': u'1', u'dateTime': u'22:16:30'}, {u'value': u'1', u'dateTime': u'22:17:30'}

...and when I process it into a summary file it looks like this:

2015-01-27,22:21:00,3
2015-01-27,22:22:00,2
2015-01-27,22:23:00,2
2015-01-27,22:24:00,2
2015-01-27,22:25:00,2
2015-01-27,22:26:00,1
2015-01-27,22:27:00,1
2015-01-27,22:28:00,1

So the first value is the date, the second value is the time and the third value is the sleep state value logged by Fitbit.  Looking at the API documentation it states these are:
  • 1 is asleep
  • 2 is awake
  • 3 is really awake
Which are slightly different to the values shown on sleep charts the Fitbit app.  Overall the values are:

Value API Doc Says Fitbit App says
1 Asleep Asleep
2 Awake Restless
3 Really Awake Awake

I analysed data for the period 27/02/2015 until 19/04/2015 which was 39,030 data points.  Breaking this down by result type I got:

ValueCountPercentage
135,20890.2%
23,2248.3%
35981.5%

So I spend more than 90% of my time in bed asleep.  This is a good thing!

I was most interested in the times that my Fitbit says I am awake; specifically analysing times when I'm awake at night when I'd rather be asleep!  Over a couple of nights, when answering the call of nature, I satisfied myself that the times when Fitbit said I was awake, I actually was awake.

So taking the raw output and putting it into Excel I:

  • Just looked at data points with a sleep value of "3" (so awake).
  • Just looked for the time period midnight to 05:00 (as there's bound to be lots of 3s at bed time and getting up time).

Taking this filtered data and plotting it a graph with the date on the x-axis and time of day on the y-axis I got this chart:


Now I'm not the greatest at interpreting graphs like this but I thought there was a definite clustering at the bottom of the graph.  This is highlighted below:


But there was only one way to prove it! A histogram showing the frequency of the times when I'm awake.  Using half hour buckets I got:


So 19.8% of the times I was awake during the night was during the period Midnight to 00:30:00. Scanning the table, it's clear to see that there's a much higher frequency of me being awake during the midnight to 02:30:00 period than from 02:30:00 until 05:00:00.  A graph makes this clear to see:


I think there's a relatively simple explanation for this pattern.  I tend to wake up each and every night to answer the call of nature (after having previously done so just before bed) and this act is reflected in the higher frequency of being awake for the first 2.5 hours after midnight.  I'm then able to settle down for a relatively solid sleep for the next 2.5 hours.

So far, so reasonably interesting (for Geeks).  At the start of this month we swapped from UTC to British Summer Time in the UK so I thought it would be interesting to see what impact this had on my "call-of-nature" induced wake-up time.  Specifically, would the clocks going forward an hour shift my wake up pattern?  This would tell me whether my night time visits to the smallest room were body clock driven or just time elapsed since my last drink.  

It's been 21 days since daylight saving time was introduced so I just picked out data 21 days either side of this point.  This gave me this chart when date and time of day are plotted:


To me it does look like there's a cluster of points later in the night after daylight saving time was introduced.  Again, let's do a frequency analysis and plot the results on a chart:


The chart is interesting, if not conclusive:
  • There's been a massive drop in the frequency of being awake during the 00:30:00 to 01:00:00 period.
  • There's been a massive spike in the frequency of being awake in the 02:00:00 to 02:30:00 period.

Looking back at the previous chart, I would say the 02:30:00 spike is down to just a single day, 14/04/2015 when I was awake for 15 minutes during the night.   I would say that the number of data points (135 in total) is not enough to draw a conclusion, being too easily skewed by one anomalous night. 

I might just sharpen up my stats skills and have another look at this to see if something of statistical significance can be observed.  All tips put in the comments section below are welcomed!!


Saturday 11 April 2015

Raspberry Pi Powered Ultra Sonic Sensing Minion Fart Gun Triggering Machine

One of the trials of 21st century life is having to trigger your own Despicable Me Minion fart gun.  Hence I thought it would be a good use of time and resources to build an automatic Minion fart gun triggering machine*.

(* I am being sarcastic by the way!  It was just a bit of Geek fun with a Raspberry Pi).

Here it is in action, (I'll then tell you how I built it):


So the idea is that the ultra sonic sensor determines when you're close to it and starts the motor which runs the machine that pulls the trigger and sets off the minion farts.

Part 1 - The Fart Gun Trigger Pulling Machine
Using my old-skool 1980s Technical Lego I built a machine that can pull the trigger on the Minion Fart gun.  Here's some pictures:


So key design features are:
  • A Lego Power Functions motor.
  • Which runs through a "gear box" to step down the speed.
  • Which powers a large Lego sprocket.
  • Which has an "arm" connected off-centre, thus turn rotary motion into reciprocating motion.
  • Which pushes a beam backwards and forwards.
What this does subsequently is easier to see on the image below:


Connected to the beam is a set of  Lego axles which are pushed backwards and forwards.  The very front axle hooks around the Fart Gun trigger to make it go off.  This is adjustable to make sure the trigger is pulled the correct amount.  A few guides with smooth tile pieces make sure everything is aligned and nothing is caught up.  Overall I had to do a lot of strategic strengthening to make sure that when the trigger is pulled the whole contraption doesn't pull itself apart.

Here's a video of it powered with a Lego battery box.


Part 2 - Ultra Sonic Sensor
I've used an HC-SR04 ultra-sonic sensor for a couple of previous Raspberry Pi Scratch projects like a press up counting machine and a simple game.  Previously I've used Scratch but for this project I decided to use Python to understand a little more about how to control the sensor and interpret the results.

I followed this tutorial, it's utterly brilliant.   I won't replicate it here but the highlights are:

  • Principles of potential dividers (required to drop the sensor's 5V output down to 3.3V for the Raspberry Pi).
  • Wiring up the sensor.
  • Python code for setting up and controlling the GPIO.
  • Python code to trigger a measurement (creating a short pulse).
  • Python code to capture the echo response duration.
  • The physics and maths behind interpreting the length of the echo pulse and turning it into a distance measurement.
It's just fascinating how tangible it is to do this through Python on the Raspberry Pi.  The result is the bulk of the code I've pasted in at the bottom of this posting.  You have:
  • Function GetAMeasurement - Which takes a measurement
  • A main loop that continuously gets a measurement and acts upon the result.

Part 3 - Controlling Motors
For this I re-used techniques I first learnt about for my Lego car project.  Read more about it there but it basically uses a motor controller board to take logic output from Raspberry Pi GPIO pins and switch on the Lego motor.  Never connect the output of the Raspberry Pi to a motor as you'll damage the Pi!

Key snippets of Python code are.
1)Constants for the GPIO pin numbers:
MOT1 = 17
MOT2 = 21

2)Defining the pins as GPIO outputs:
GPIO.setup(MOT1,GPIO.OUT)
GPIO.setup(MOT2,GPIO.OUT)

3)Controlling the pins based upon distance measurements:

  if (TheDistance < 100):
    #Switch motor on
    print "Get farting!"
    GPIO.output(MOT1, True)
    GPIO.output(MOT2, False)
  elif (TheDistance < 10):
    #Switch motor off
    GPIO.output(MOT1, False)
    GPIO.output(MOT2, False)
  else:
    #Switch motor off
    GPIO.output(MOT1, False)
    GPIO.output(MOT2, False)

So if the measurement from the sensor is greater than 100cm or less than 10cm, keep the motor turned off.  Otherwise, turn the motor on by setting one of the GPIO pins as high.  I do the < 10cm check for Lego maintenance purposes, (i.e. if it breaks!).  It means that by covering the sensor I can leave the Python script running and be close to the sensor to tinker with stuff without triggering the farts.

Aside - Wiring it Up
One thing I learnt during this project was the different ways to reference the pins on the Raspberry Pi GPIO.  On previous projects I've specified:

GPIO.setmode(GPIO.BOARD)

...which means reference the pins exactly how they're laid out on the GPIO.  e.g. Pin 11 in the code refers to pin 11 on the GPIO.

The code from the ultra sonic sensor tutorial specified:

GPIO.setmode(GPIO.BCM)

...which means reference the pins how the Broadcom chip references them.  This is explained on this Stack Exchange answer.  What I actually did is best explained with a picture.  Here's how I had it wired up:


Here's a picture of it wired up:


When looking at the sensor from behind:
  • The right hand pin is VCC and is wired to +5V on the Pi.
  • The next to right hand pin is Trig and the green jumper wire goes to GPIO23 as shown on the diagram above.
  • The left hand pin is Ground and is wired to Ground on the Pi.
  • The next to left hand pin is Echo and has a 2k ohm resistor coming from it to a spare track on the bread board.  From the same track, the yellow jumper wire goes to GPIO24 on the Pi and the 1k ohm resistor goes to the Ground rail (which is connected to Ground on the Pi). 


All the Code
As ever on the Geek Dad blog, here's all the code:

#Used https://www.modmypi.com/blog/hc-sr04-ultrasonic-range-sensor-on-the-raspberry-pi as a tutorial

#Import statememts
import RPi.GPIO as GPIO
import time
import datetime

#Set GPIO numbering mode
GPIO.setmode(GPIO.BCM)
GPIO.setwarnings(False)

#Constants for the trigger and echo pins
#http://raspberrypi.stackexchange.com/questions/12966/what-is-the-difference-bet
ween-board-and-bcm-for-gpio-pin-numbering
TRIG = 23
ECHO = 24
MOT1 = 17
MOT2 = 21

#Other constants
WaitVar = 1

#Initial message
print 'Distance Measurement In Progress'

#Set up our GPIO inputs and outputs
GPIO.setup(TRIG,GPIO.OUT)
GPIO.setup(ECHO,GPIO.IN)
GPIO.setup(MOT1,GPIO.OUT)
GPIO.setup(MOT2,GPIO.OUT)

#Routine to initialise the sensor
def InitaliseSensor(TrigPin):
  #Initialise the sensor
  GPIO.output(TrigPin, False)
  print "Waiting For Sensor To Settle"
  time.sleep(2)

def GetAMeasurement(TrigPin,EchoPin):
  #Send a pulse that is 10us long
  GPIO.output(TrigPin, True)
  time.sleep(0.00001)
  GPIO.output(TrigPin, False)

  #Keep looping while we wait for a response
  while GPIO.input(EchoPin)==0:
    pulse_start = time.time()  #So when we come out of this loop the start time will be logged

  #Now keep looping while the response comes in (pin is high)
  while GPIO.input(ECHO)==1:
    pulse_end = time.time()    #So when this loop ends the end time will be logged

  #Calculate pulse duration
  pulse_duration = pulse_end - pulse_start

  #Speed = Distance / Time. Hence Distance = Speed * Time.  Speed is speed of sound = 343m/s or 34300cm/2.  Divide resulting answer by 2 as it's a return trip
  distance = pulse_duration * 17150
  distance = round(distance,2)

  #return the distance
  return distance

####Main code body####
#Initialise the sensor
InitaliseSensor(TRIG)

while True:
  #Get the distance
  TheDistance = GetAMeasurement(TRIG,ECHO)

  #Print the result
  print "Distance:",TheDistance,"cm"

  #Wait a bit
  time.sleep(WaitVar)

  #See if someone is close
  if (TheDistance < 100):
    #Switch motor on
    print "Get farting!"
    GPIO.output(MOT1, True)
    GPIO.output(MOT2, False)
  elif (TheDistance < 10):
    #Switch motor off
    GPIO.output(MOT1, False)
    GPIO.output(MOT2, False)
  else:
    #Switch motor off
    GPIO.output(MOT1, False)
    GPIO.output(MOT2, False)

#Clean up the GPIO
GPIO.cleanup()


Sunday 5 April 2015

Watering System Using Moeller "Easy" Programmable relay

It's Easter time and the Geek family are spending the long weekend at my in-laws' house.  However just because we're away it doesn't mean there's no time for Geekiness.

My father-in-law is a retired Service Engineer / Electrician and is a genius with mains powered items like mechanical timers, relays, solenoids and also plumbing systems.  He's built himself an automatic watering system for garden, greenhouse and hanging basket using various salvaged parts and wants to consolidate it down to one simple to maintain system.

For this he had a Moeller Easy 412-AC-R programmable relay that he wanted to use to control 4 independent watering systems.  His skills (mains, wiring, plumbing etc) are complementary to mine (occasional exercise, drinking coffee, hacking poor quality code) so he asked me to help him program the relay.

The unit is shown on the image below:


The unit is AC powered and has:
  • Eight screw terminals to which you can connect mains inputs (240V AC in the UK).  These are the "I" inputs at the top of the image.
  • Four pairs of screw terminals which are relay contacts through which you can switch mains power items.  These are the "Q" outputs at the bottom of the image.
  • The cursor buttons that act as "P" inputs.
  • A set of other internal controls like counters and timers.
  • A UI comprising the buttons shown on the picture above which let you create "circuit diagrams" on the LCD screen.

So using the UI you create circuits on the screen that connect together inputs (in series or parallel), trigger timers and control outputs.  A few hours tinkering and grudgingly RTFMing led me to this circuit diagram:


In pseudo code this would be written:

if (P1 == Pressed) or (I1 == True):
  set Output Q1 = Switched

while Time < T1:
  #Do nothing

set Output Q1 = Unswitched

So either pressing button P1 (left cursor) or applying mains voltage to input I1 connects the contacts on relay Q1.  Timer T1 then starts and, when it expires, the contacts on relay Q1 are disconnected.

This code was replicated three times, each time using I1 and P1 as triggers but using Q2, Q3 and Q4 and  T2, T3 and T4.  In this way a single input can be used to control 4 outputs, each with independent timers (because, say, tomatoes in the greenhouse need more water than hanging baskets).

The picture below shows the full test rig:


A light bulb is wired to one of the Moeller relays and the orange timer unit on the far right is wired to the Moeller input.  This timer is in turn connected directly to mains power for test purposes.  What happens here is that when the mains is switched on and left on, the orange timer can be set to only provide a mains output for a very short period of time (~6s in our case) to trigger the Moeller input.  This in turn triggers the Moeller outputs for the programmed period of time.

In the final system the mains input will be replaced by a mechanical timer (can be seen in the metal box on the left towards the top) that can be configured to come on at certain times of day but is not very precise in terms of how long it can be set to come on for.  

The Moeller outputs will be used to switch a set of solenoid valves that control the mains pressure water supply to the watering systems around my father in-law's house.  

So what we have is:
  • An imprecise time of day mechanical switch.

...triggering....
  • A precise trigger.

...which acts as the input to....
  • The Moeller relay with four separate timer controlled relays

...which controls...
  • A set of solenoid valves that control the water flow.

So overall this is very different to my usual tinkering which involves Raspberry Pis, Python, APIs and weedy DC electricity.  Great fun!       

Thursday 2 April 2015

Exercise Analytics Using Raspberry Pi, MySQL and APIs

Many of the posts I've been doing since the end of 2014 have been about using exercise API data and exercise database data to ensure I keep fit and healthy.  Key examples are:


This has taught me a lot about myself, in particular the need to set myself targets and periodically measure myself against these targets.  Back in early January 2015 I sent myself an email with this set of targets in it:


It's one quarter into the year, it's time to see how I'm doing against the targets.  First I needed to calculate a set of targets for the quarter.  I did this as Year / 4 rounded up to the nearest integer.  This makes the targets:


(Fitbit based Steps - St and Sleep - Sl have been "pro-rated" as I only got the device at the end of January).

So taking each exercise type in turn, here's how I got the data to compare with the targets.

Strava Data
This is cycling, swimming and running data logged using my Garmin sports watch and uploaded to Strava.

For this I wrote a Python script to extract information from the Strava API.  Full code at the bottom of this post but here's some highlights.

A obtained all the data with a single URL request to the Strava API:
urllib2.urlopen('https://www.strava.com/api/v3/activities?access_token=' + StravaToken + '&per_page=200&after=' + TheUnixTime).read()

Here the per_page=200 entity reference means give me 200 records (more than enough for my Strava efforts) and after= means give all records after the specified period (which is defined in Unix time).

The resulting JSON defeated all my ham-fisted attempts to parse using simple methods so I ended up using the json Python module.  This made life a lot easier!  So with:

StravaJSON = json.loads(StravaText)to access the JSON structures.

...and the likes of ...

StravaJSON[i]['type'] to access specific fields.

...it was easy enough to loop through the whole set of records, pick out all the swims, runs and cycles, add together the distances and write the results.  The output was:

pi@raspberrypi ~/exercise $ sudo python strava_v1.py
Swim Count: 13. Swim Distance: 15600.0
Bike Count: 28. Bike Distance: 282693.4
Run Count: 12. Run Distance: 68337.6

(All distances in metres)

Jerks Exercises
Previously I blogged on how I used a MySQL database on my raspberry Pi to log "physical jerks" (e.g. press ups and sits ups).  I communicate these using a simple code sent in a tweet.

Getting all the data is as simple as running an SQL query.  Here's what I got:

mysql> SELECT exercise, SUM(count) FROM exercise where tdate >= "2015-01-01" GROUP BY exercise order by sum(count);
+--------------------+------------+
| exercise           | SUM(count) |
+--------------------+------------+
| Pilates            |         13 |
| Yoga               |         13 |
| Leg Weights        |         16 |
| Hundred Ups        |         19 |
| General Stretching |         23 |
| Foam Rolling       |         25 |
| Squatting          |        112 |
| Arm Raises         |        322 |
| Side Raises        |        322 |
| Clap Press Ups     |        328 |
| Bicep Curls        |        342 |
| Shoulder Press     |        367 |
| Tricep Curls       |        374 |
| Sit Ups            |        789 |
| Abdominal Crunches |       1429 |
| Press Ups          |       1501 |
| Calf Raises        |       1839 |
+--------------------+------------+

Easy!

Fitbit Data
For the sleep data from my Fitbit Charge HR I re-used code that I used for my sleep infographic.  This gave me a per day sleep figure that I simply summed to give me the total sleep for the period.

For steps data (and floors climbed data) I simply modified the sleep code to 1)access the activities resource and 2)pull out the steps and floors data.  Full code below.  Key parts were getting activity data from the API using fitbit-python:

fitbit_data = authd_client._COLLECTION_RESOURCE('activities',DateForAPI)

.and extracting steps and floors from the resulting JSON:

#Get the total steps value
TotalSteps = fitbit_data['summary']['steps']

#Get the total floors value
TotalFloors = fitbit_data['summary']['floors']

Again I simply summed the data from the summary file to give me the single figure I needed.

Overall Result
Here's a table with the overall result.  Green means target met or exceeded, red means not met.


Observations:

  • I nailed all the "counting" targets
  • I missed all the harder qualitative targets (e.g. cycling and running speed).
  • Some counting targets I only just sneaked in (e.g. Yoga and Pilates).  This is generally stuff I don't like doing.
  • Some counting targets I exceeded by a fair amount (e.g. press ups).  These are things I like doing!

So I need to find a way to beat the speed targets I set.  How can technology help me with that??

(I've also added a new target for floors climbed based upon my Q1 daily average).

Strava - Code

import urllib2
import json

#Constants - For Strava
StravaToken = '<Key Here>'


#From http://www.onlineconversion.com/unix_time.htm
TheUnixTime = '1420070400'

#Access the Strava API using a URL
StravaText = urllib2.urlopen('https://www.strava.com/api/v3/activities?access_token=' + StravaToken + '&per_page=200&after=' + TheUnixTime).read()
#print StravaText

#Parse the output to get all the information.  Set up some variables
SwimCount = 0
SwimDistance = 0
RunCount = 0
RunDistance = 0
BikeCount = 0
BikeDistance = 0

#See how many Stravas there are.  Count the word 'name' as there's one per record
RecCount = StravaText.count('name')

#Load the string as a JSON to parse
StravaJSON = json.loads(StravaText)

#Loop through each one
for i in range(0,RecCount):
  #See what type it was and process accordingly
  if (StravaJSON[i]['type'] == 'Swim'):
    SwimCount = SwimCount + 1
    SwimDistance = SwimDistance + StravaJSON[i]['distance']
  elif (StravaJSON[i]['type'] == 'Ride'):
    BikeCount = BikeCount + 1
    BikeDistance = BikeDistance + StravaJSON[i]['distance']
  elif (StravaJSON[i]['type'] == 'Run'):
    RunCount = RunCount + 1
    RunDistance = RunDistance + StravaJSON[i]['distance']

#Print results
print 'Swim Count: ' + str(SwimCount) + '. Swim Distance: ' + str(SwimDistance)
print 'Bike Count: ' + str(BikeCount) + '. Bike Distance: ' + str(BikeDistance)
print 'Run Count: ' + str(RunCount) + '. Run Distance: ' + str(RunDistance)


Fitbit - Code

import fitbit
from datetime import datetime, timedelta
import time

#Constants
CLIENT_KEY = '<Yours Here>'
CLIENT_SECRET = '<Yours Here>'
USER_KEY = '<Yours Here>'
#USER_KEY = '<Yours Here>'
USER_SECRET = '<Yours Here>'

#The first date I used Fitbit
FirstFitbitDate = '2015-01-27'

#Determine how many days to process for.  First day I ever logged was 2015-01-27
def CountTheDays():
  #See how many days there's been between today and my first Fitbit date.
  now = datetime.now()                                         #Todays date
  FirstDate = datetime.strptime(FirstFitbitDate,"%Y-%m-%d")    #First Fitbit date as a Python date object

  #Calculate difference between the two and return it
  return abs((now - FirstDate).days)

#Produce a date in yyyy-mm-dd format that is n days before today's date (where n is a passed parameter)
def ComputeADate(DaysDiff):
  #Get today's date
  now = datetime.now()

  #Compute the difference betwen now and the day difference paremeter passed
  DateResult = now - timedelta(days=DaysDiff)
  return DateResult.strftime("%Y-%m-%d")

#Get a client
authd_client = fitbit.Fitbit(CLIENT_KEY, CLIENT_SECRET, resource_owner_key=USER_KEY, resource_owner_secret=USER_SECRET)

#Find out how many days to compute for
DayCount = CountTheDays()

#Open a file to write the output - minute by minute and summary
SummaryFileToWrite = '/home/pi/exercise/' + 'summary_' + datetime.now().strftime("%Y-%m-%d") + '.csv'
SummaryFile = open(SummaryFileToWrite,'w')

#Process each one of these days stepping back in the for loop and thus stepping up in time
for i in range(DayCount,-1,-1):
  #Get the date to process
  DateForAPI = ComputeADate(i)

  #Tell the user what is happening
  print 'Processing this date: ' + DateForAPI

  #Get sleep
  fitbit_data = authd_client._COLLECTION_RESOURCE('activities',DateForAPI)

  #Get the total steps value
  TotalSteps = fitbit_data['summary']['steps']

  #Get the total floors value
  TotalFloors = fitbit_data['summary']['floors']

  #Write a log of summary data
  SummaryFile.write(DateForAPI + ',' + str(TotalSteps) + ',' + str(TotalFloors) + ',' '\r\n')

  #Wait a bit (for API rate limit)
  time.sleep(1.1)

#We're now at the end of the loop.  Close the file
SummaryFile.close()


Tuesday 24 March 2015

Sleep Infographic Using Raspberry Pi and Fitbit API

Infographics.  They're everywhere.  Here's one I did (it's my first one so be kind!):


So why did I do this?  In a previous post I spotted how the Fitbit API contains lots of delicious Geek data for me to analyse.  Hence I wanted to extract this data, analyse it and present it.  My inclination is to present  detailed charts and tables of data but I decided to present it as an infographic as they seem to be everywhere these days.

In terms of my Fitbit Charge HR and sleep measurement, I think it's reasonably accurate.  If I've had a good night sleep then this is generally registered.  Similar for a bad nights sleep.  When I get up in the night  to answer nature's call it's always logged.  Needs more analysis to be sure though...

So the process was:
  • Write a Python script on my Raspberry Pi to access the Fitbit API.
  • Have the script output data in a raw format.
  • Use Excel to process and present the data.  

Full code is at the bottom but highlights from it are summarised below.

Accessing the API
Uses methods described in this previous post.  Snippet:

#Get a client
authd_client = fitbit.Fitbit(CLIENT_KEY, CLIENT_SECRET, resource_owner_key=USER_KEY, resource_owner_secret=USER_SECRET)

Calculating How Many Days to Process For
The Fitbit API takes a single date as a parameter.  I wanted to process for every day that I'd had the Fitbit.  Hence I wrote a function called CountTheDays() to count how many days had passed between the day the script is run and the day I got my Fitbit.

Looping through Each Day
Having the number of days to process for, I could then create a for loop to look at each day in turn.  

This snippet:

for i in range(DayCount,-1,-1):
  #Get the date to process
  DateForAPI = ComputeADate(i)

Means you loop with the loop var i decrementing each time.  It starts off back at the first day I got the Fitbit and finishes on today's date.

The code then gets an actual date using ComputeADate(i) which means it computes a date that is i days different from today.

Getting the API Data
This method gets the API data for you:
fitbit_sleep = authd_client._COLLECTION_RESOURCE('sleep',DateForAPI)

...and the resulting JSON structure starts like this:
{u'sleep': [{u'logId': 778793259, u'isMainSleep': True, u'minutesToFallAsleep': 0, u'awakeningsCount': 26, u'minutesAwake': 45, u'timeInBed': 483, u'minutesAsleep': 417, u'awakeDuration': 11, u'efficiency': 90, u'startTime': u'2015-03-16T22:18:00.000', u'restlessCount': 29, u'duration': 28980000, u'restlessDuration': 52, u'minuteData': 

....has a bunch of "per minute" records like this....

{u'value': u'1', u'dateTime': u'22:38:00'}, {u'value': u'1', u'dateTime': u'22:39:00'}, {u'value': u'1', u'dateTime': u'22:40:00'}

...then finishes with more summary data like this.

u'awakeCount': 3, u'minutesAfterWakeup': 1}], u'summary': {u'totalTimeInBed': 483, u'totalMinutesAsleep': 417, u'totalSleepRecords': 1}}

Extracting Elements of the JSON
Using my patented trial and error method I managed to work out you pick out different parts of the JSON like this:

#Get the total minutes in bed value.  This will control our loop that gets the sleep
MinsInBed = fitbit_sleep['sleep'][0]['timeInBed']

#Get the total sleep value
MinsAsleep = fitbit_sleep['sleep'][0]['minutesAsleep']

...and that the [timeInBed] field could be used to determine how many per minute records there are.  Hence you can loop, logging each of the per minute records:

#Loop through the lot
  for i in range(0,MinsInBed):
    SleepVal = fitbit_sleep['sleep'][0]['minuteData'][i]['value']
    TimeVal = fitbit_sleep['sleep'][0]['minuteData'][i]['dateTime']
    MyFile.write(DateForAPI + ',' + TimeVal + ',' + SleepVal + '\r\n')
    
If this is the first loop iteration, grab the time which is when Fitbit thought I went to bed:

    if (i == 0):
      FirstTimeInBed = TimeVal

Logging to File
In the loop above I log the per minute data to file.  I also log summary data to file like this:

#Write a log of summary data
  SummaryFile.write(DateForAPI + ',' + str(MinsInBed) + ',' + str(MinsAsleep) + ',' + FirstTimeInBed + '\r\n')

One of these logs is written per day.

Analysing the Summary Data
I'll leave analysis of the per minute data until later, (can't think what to do with it now).  The summary data looks like this:

2015-01-27,478,434,22:21:00
2015-01-28,447,420,22:50:00
2015-01-29,491,446,22:11:00
2015-01-30,414,359,23:29:00


The format is:
<Date>,<Minutes in bed>,<Minutes asleep>,<Bed Time>

So for the infographic I used Excel to:

1-Add up all the time asleep values to give the total time asleep (expressed in hours).

2-Worked out the average time asleep each night (again expressed in hours).

3-Used a pivot table to examine the data on a per day of week basis.


So the Saturday to Sunday sleep is my best at a mean of 7.6 hours.  Sunday to Monday sleep is the worst at 5.8 hours (this is because I do a swim training session which finishes late on a Sunday night so I go to bed later and am also a bit wired so it takes me longer to get to sleep). 

4-Worked out an "efficiency" figure by calculating what proportion of time in bed I'm actually asleep for.

5-Looked at the frequency distribution of Fitbit logged bed time:


The mode value of 22:12 went on the infographic.  Latest bed time is still before midnight.  Rock 'n' roll baby!

Full Code
Secret stuff changed of course.  Look at my previous posts to see how to authenticate etc.

#V1 - Minute by minute data
#V2 - Summary data added

import fitbit
from datetime import datetime, timedelta

#Constants
CLIENT_KEY = 'uptownfunkyouup'
CLIENT_SECRET = 'livinlifeinthecity'
USER_KEY = 'iliketomoveitmoveit'
#USER_KEY = 'iliketomoveitmove'
USER_SECRET = 'iliketohuhmoveit'

#The first date I used Fitbit
FirstFitbitDate = '2015-01-27'

#Determine how many days to process for.  First day I ever logged was 2015-01-27
def CountTheDays():
  #See how many days there's been between today and my first Fitbit date.
  now = datetime.now()                                         #Todays date
  FirstDate = datetime.strptime(FirstFitbitDate,"%Y-%m-%d")    #First Fitbit dat
e as a Python date object

  #Calculate difference between the two and return it
  return abs((now - FirstDate).days)

#Produce a date in yyyy-mm-dd format that is n days before today's date (where n is a passed parameter)
def ComputeADate(DaysDiff):
  #Get today's date
  now = datetime.now()

  #Compute the difference betwen now and the day difference paremeter passed
  DateResult = now - timedelta(days=DaysDiff)
  return DateResult.strftime("%Y-%m-%d")

#Get a client
authd_client = fitbit.Fitbit(CLIENT_KEY, CLIENT_SECRET, resource_owner_key=USER_KEY, resource_owner_secret=USER_SECRET)

#Find out how many days to compute for
DayCount = CountTheDays()

#Open a file to write the output - minute by minute and summary
FileToWrite = '/home/pi/sleep/' + 'minuteByMinute_' + datetime.now().strftime("%Y-%m-%d") + '.csv'
MyFile = open(FileToWrite,'w')
SummaryFileToWrite = '/home/pi/sleep/' + 'summary_' + datetime.now().strftime("%Y-%m-%d") + '.csv'
SummaryFile = open(SummaryFileToWrite,'w')

#Process each one of these days stepping back in the for loop and thus stepping up in time
for i in range(DayCount,-1,-1):
  #Get the date to process
  DateForAPI = ComputeADate(i)

  #Tell the user what is happening
  print 'Processing this date: ' + DateForAPI

  #Get sleep
  fitbit_sleep = authd_client._COLLECTION_RESOURCE('sleep',DateForAPI)

  #Get the total minutes in bed value.  This will control our loop that gets the sleep
  MinsInBed = fitbit_sleep['sleep'][0]['timeInBed']

  #Get the total sleep value
  MinsAsleep = fitbit_sleep['sleep'][0]['minutesAsleep']

  #Loop through the lot
  for i in range(0,MinsInBed):
    SleepVal = fitbit_sleep['sleep'][0]['minuteData'][i]['value']
    TimeVal = fitbit_sleep['sleep'][0]['minuteData'][i]['dateTime']
    MyFile.write(DateForAPI + ',' + TimeVal + ',' + SleepVal + '\r\n')
    #If this is the first itteration of the loop grab the time which says when I got to bed
    if (i == 0):
      FirstTimeInBed = TimeVal

  #Write a log of summary data
  SummaryFile.write(DateForAPI + ',' + str(MinsInBed) + ',' + str(MinsAsleep) + ',' + FirstTimeInBed + '\r\n')
#We're now at the end of theloops.  Close the file
MyFile.close()
SummaryFile.close()